


Analytics tells you what people actually did with your video — not just how many pressed play.
Requires TruePlayer Pro.
Where to Find It
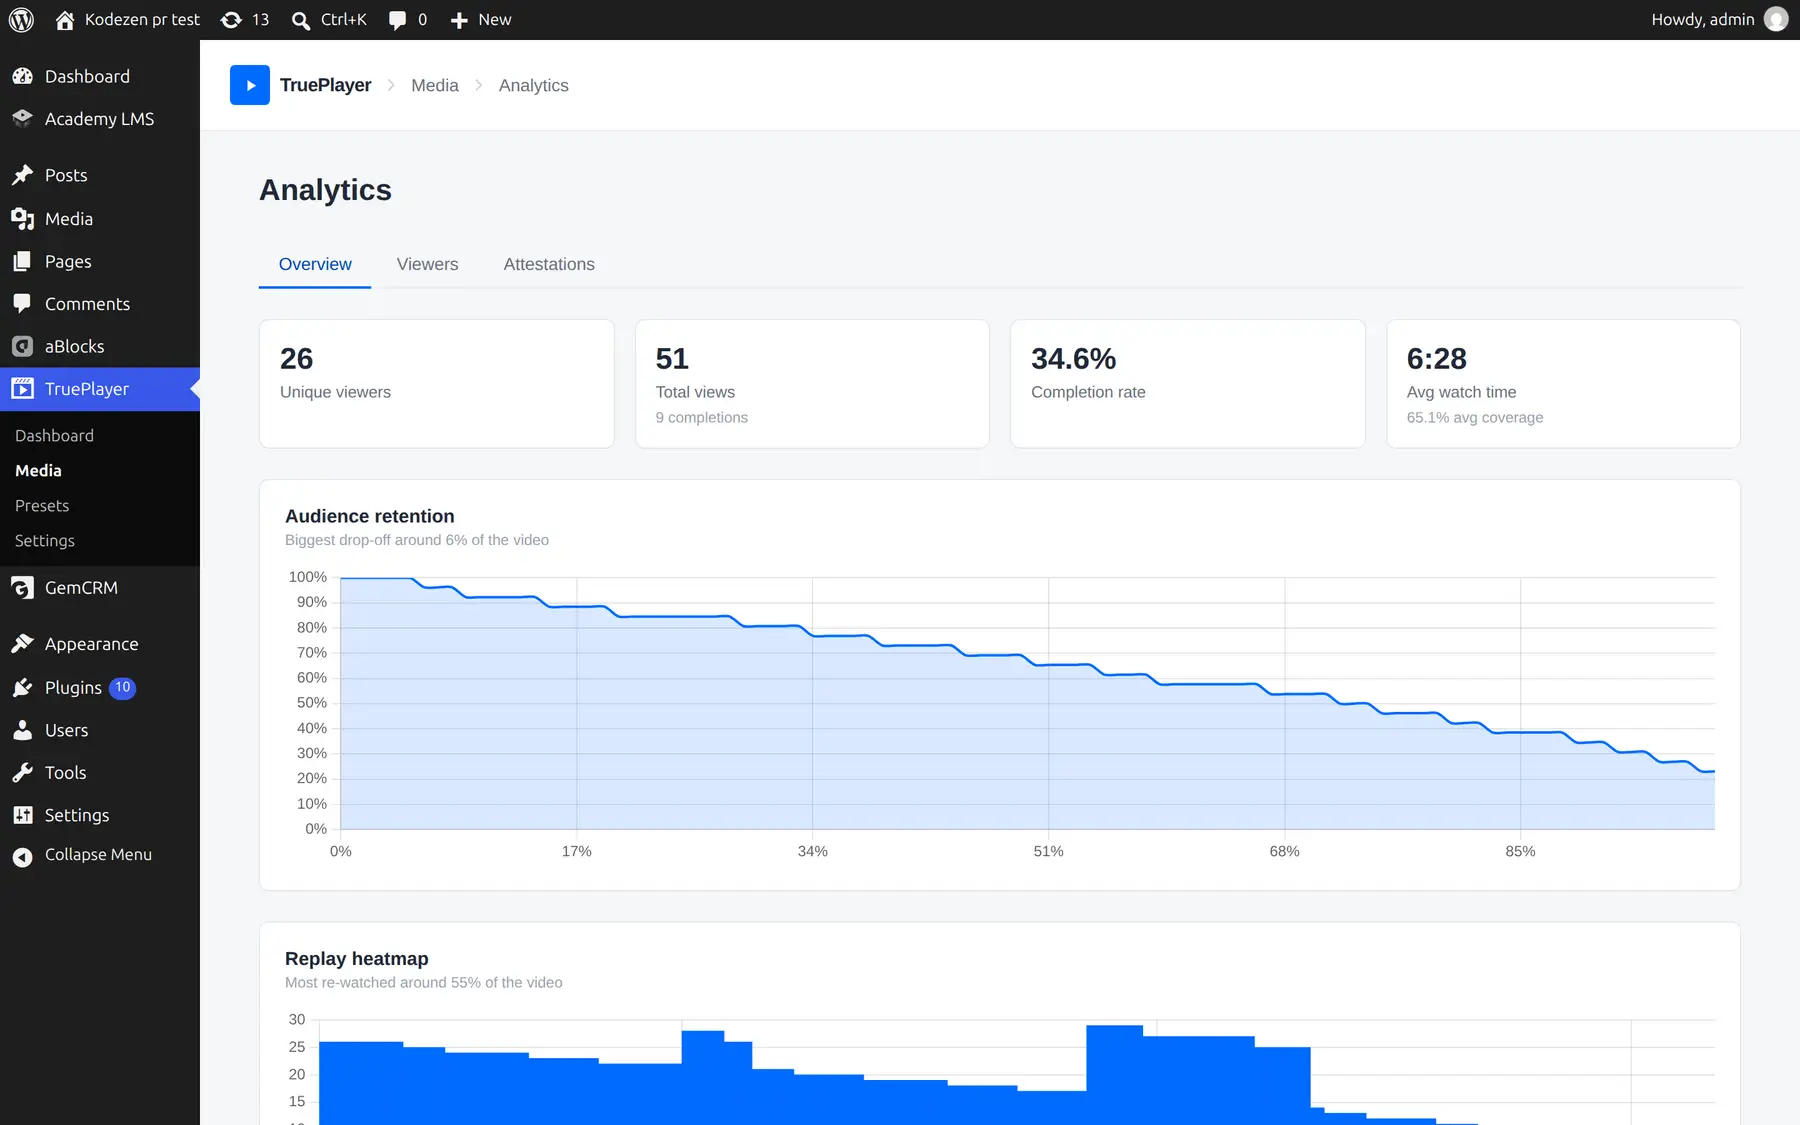
Go to TruePlayer → Media, find your video, and choose Analytics from its row menu. You can also reach it from inside the editor.
The Headline Numbers
Four cards across the top:
|
Number |
What it means |
|
Unique viewers |
How many different people watched |
|
Total views |
How many viewing sessions there were, with completions underneath |
|
Completion rate |
The share of viewers who genuinely finished |
|
Avg watch time |
Average time watched, with average coverage underneath |
Views vs viewers. One person watching three times is 1 viewer and 3 views. A large gap between the two means people are coming back — often a good sign.
Watch time vs coverage. Watch time counts everything played, including re-watches. Coverage counts distinct parts of the video. If watch time is high but coverage is low, people are re-watching a small section — usually because it is either very good or very confusing.
Views Over Time
A daily trend line showing views and completions.
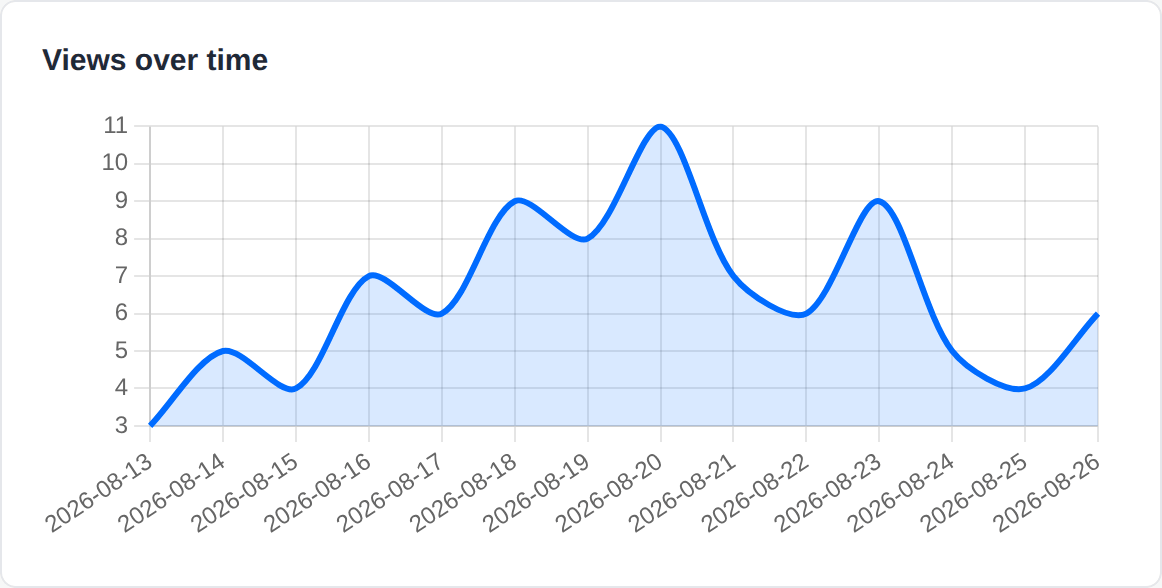
Useful for seeing the effect of a campaign, an email send, or a course launch.
The Retention Curve
The most useful chart in the screen. It shows what percentage of viewers were still watching at each point in the video.
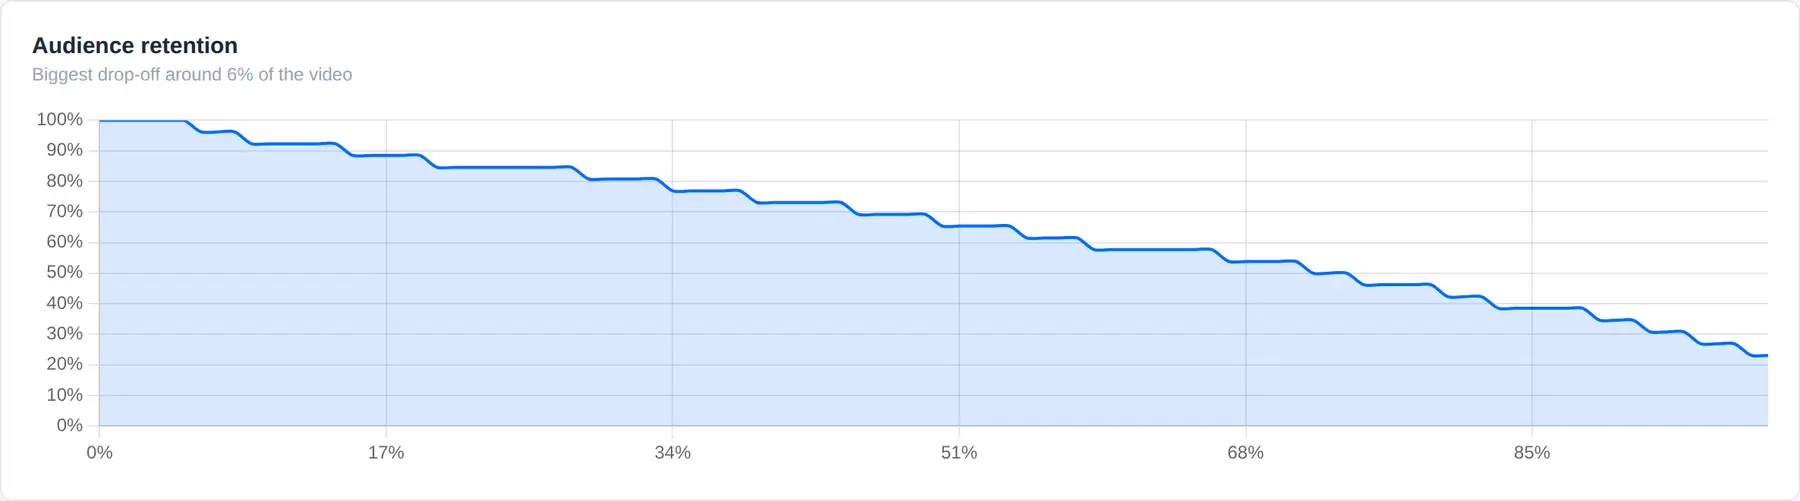
How to read it:
The single most valuable habit: when you see a cliff, open the video at that timestamp and watch it. The reason is almost always obvious once you look.
|
Shape |
What it usually means |
|
A steep drop right at the start |
Your opening isn’t earning attention, or the video is mislabelled |
|
A cliff at a specific moment |
Something at that exact moment loses people — go and watch it |
|
A gentle, steady decline |
Normal and healthy |
|
A rise partway through |
People are jumping back to re-watch that part |
The Replay Heatmap
Shows which parts of the video get played most, including repeats.
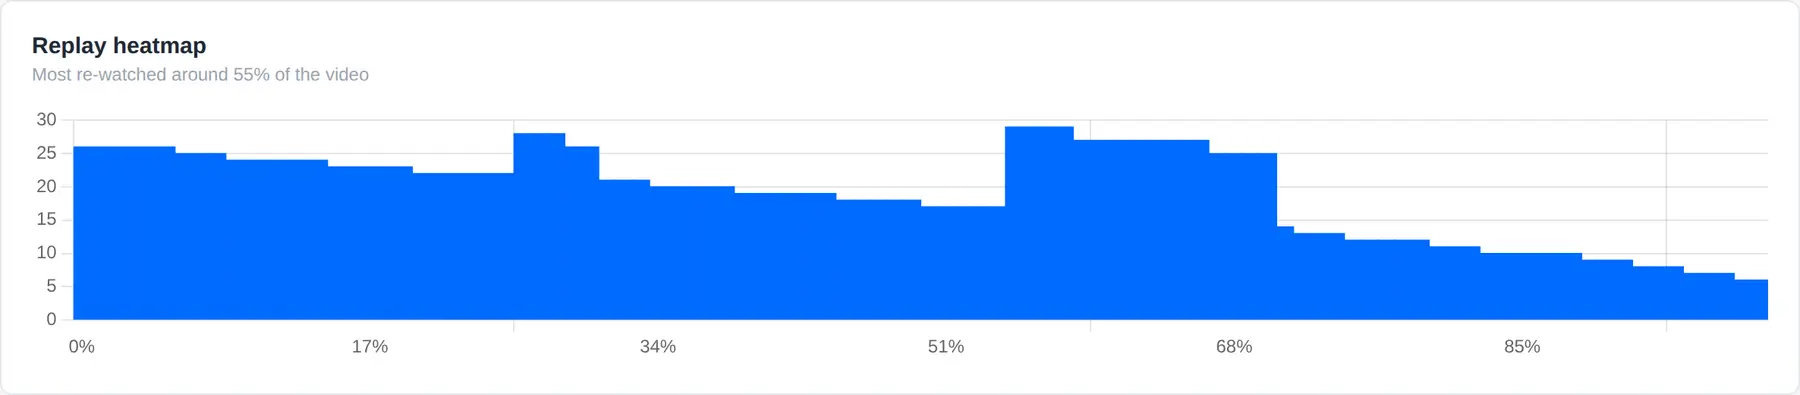
Hot spots mean one of two things:
- This bit was great — people re-watched it because they liked it
- This bit was confusing — people re-watched it because they didn’t follow it the first time
Watching the segment usually makes it obvious which. Confusing hot spots are a clear signal to re-record or add a chapter.
New vs Returning
How many of your viewers are watching for the first time versus coming back. A high returning number on reference or training content is a good sign; on a marketing video it may mean the message isn’t landing first time.
Quiz Performance
Pass rates and how many attempts people typically need.
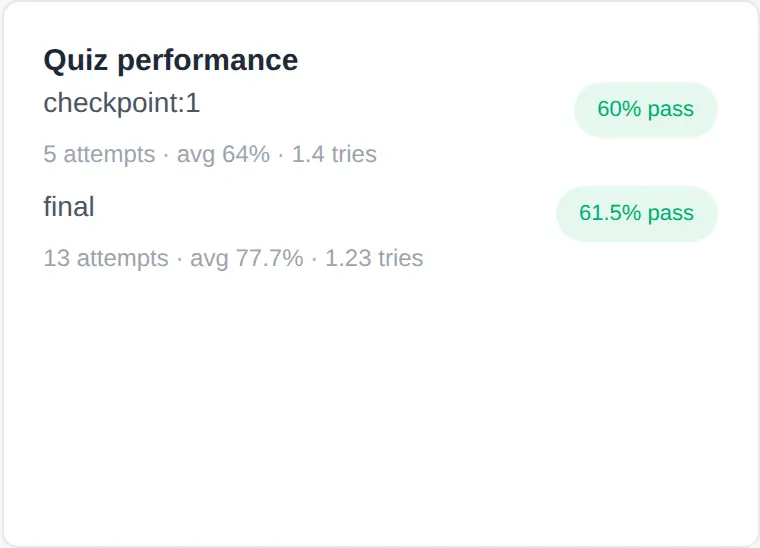
A very low pass rate usually means the questions ask about something the video doesn’t clearly cover — worth checking before you assume viewers weren’t paying attention.
A 100% pass rate on the first attempt may mean the questions are too easy to be evidence of anything.
The Viewer Table
Every individual who watched:
|
Column |
Shows |
|
Viewer |
Their name and email if logged in, otherwise an anonymous guest |
|
Coverage |
How much they genuinely watched |
|
Sessions |
How many separate viewing sessions |
|
Status |
In progress, completed or locked |
|
Device |
Desktop, mobile or tablet |
Viewer Detail
Click any row to open that person’s detail:
- Their personal replay heatmap — which parts they re-watched
- Their full quiz attempt history — every attempt, score and result
- A Reset / unlock button, for when someone deserves a fresh start
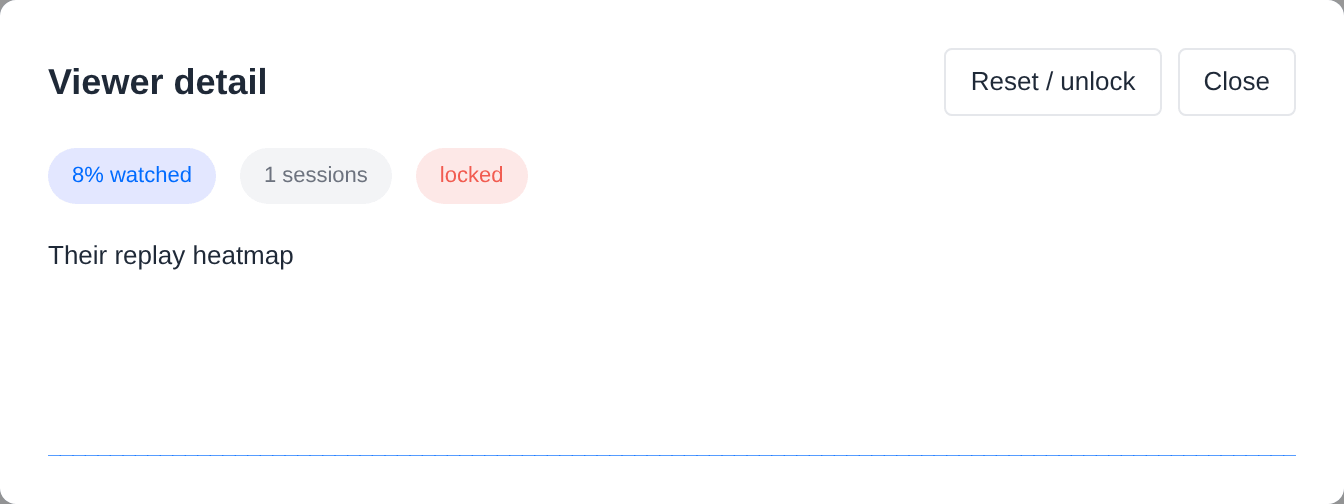
This is the screen you use when a learner emails to say they are stuck.
Exporting
Click Export CSV to download the viewer data for use in a spreadsheet, an LMS report, or your own records.
Frequently Asked Questions
Why do some viewers show as anonymous?
They weren’t logged in. Anonymous visitors are tracked by cookie, which cannot tell you who they are. Turn on Require login to watch if you need names.
Can I turn analytics collection off?
Yes — Settings → Analytics → Collect video analytics. Gating keeps working; you just stop storing the charts.
How long is data kept?
Forever, unless you turn on auto-purge in Settings → Compliance & privacy.
My numbers look low compared to another tool.
That is expected, and it’s the point. TruePlayer counts genuine watching, not play button clicks. Other tools usually report a higher, less meaningful number.
Does the retention curve work for short videos?
Yes. The timeline is measured in percentages, so the chart reads the same whether the video is 30 seconds or 3 hours.
Can I see analytics across all videos at once?
Analytics is per video. Use Export CSV to combine them in a spreadsheet.